The Case-Shiller home price index is the most accurate measure of aggregate prices, and as such it is great for long-term comparisons. It also provides a useful distinction by breaking the price data into three tiers of expensiveness.
The downside is that numbers are very “stale.” The recent September release, for example, only has price data through July, and that figure actually is calculated from sales that took place as early as May.
Because I haven’t done much in the way of long-term comparisons, and because there was little of interest in the tiered data (all three price tiers have been acting very similar to one another), I haven’t done a CS update in a while. Let’s check in on the most recent numbers.
The recent increase in prices that I’ve been occasionally documenting is clear in this chart of prices since the post-crash (aggregate) bottom in 2009. For the year-to-date through July, the aggregate index is up a bit over 5 percent, and the low, mid, and high price tiers are all up similar amounts:

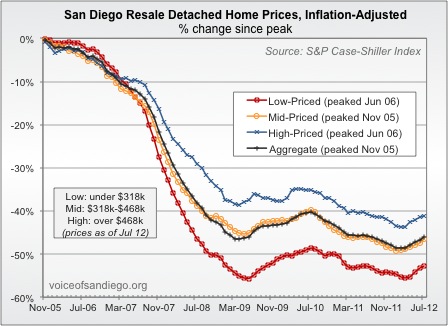
Zooming out, here’s a look starting at the bubble peak:

Here’s a version of the above chart that adjusts for inflation. In inflation-adjusted terms, the aggregate index hit a post-bubble low in February of this year. Even with the price increase since then, aggregate prices have essentially gone nowhere since the crash phase ended in 2009.
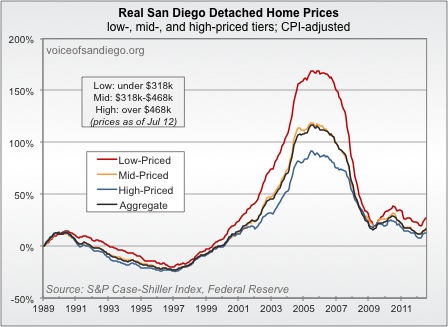
Here’s a very long term look, against adjusted for inflation, going as far back as the tiered data is available.
That’s the scoop on the CS index. Remember, the charts above are only current through July. We can get a more updated read by looking at the resale data, which indicates that prices have continued to rise since then. Here’s a chart of the median price per square foot starting at the peak and ending in September 2012:

The chart of housing supply and price changes that I’ve been highlighting lately has continued to be very effective in predicting price direction.

This chart also continues to predict further upward pressure in the months immediately ahead.
Rich Toscano is a financial advisor with Pacific Capital Associates*. He can be contacted at rtoscano@pcasd.com.